|
PCSTATS is testing out SanDisk's Extreme 240GB SSD, a 6Gb/s SATA III drive rated to 550MB/s Read and 520MB/s Write (sequential) in ATTO Disk Benchmark. SanDisk's Extreme SSD uses 24nm Toggle Mode MLC NAND Flash and the popular LSI SandForce SF-2281 controller.
88% Rating: 
|
|
|
|
Home >
Reviews >
Hard Drives/SSD >
SanDisk SDSSDX-240G-G25 |
|
|
SSD vs HDD Benchmarks: HD Tune Pro 4.01
 HD Tune Pro 4.01 Benchmark - READ
Tests HD Tune Pro 4.01 Benchmark - READ
Tests |
Source: HD
TUNE |
|
HD Tune
Pro is an extended version of HD Tune which includes many new features such as:
write benchmark, secure erasing, AAM setting, folder usage view, disk monitor,
command line parameters and file benchmark. The benchmark measures raw
performance in a couple different ways to measure a hard drive for Read and
Write tests, which are conducted separately. To read the results below consider
that highest minimum/maximum/average transfer rates are better, while lower
(quicker) access times are best. Lastly, highest burst rates are better.
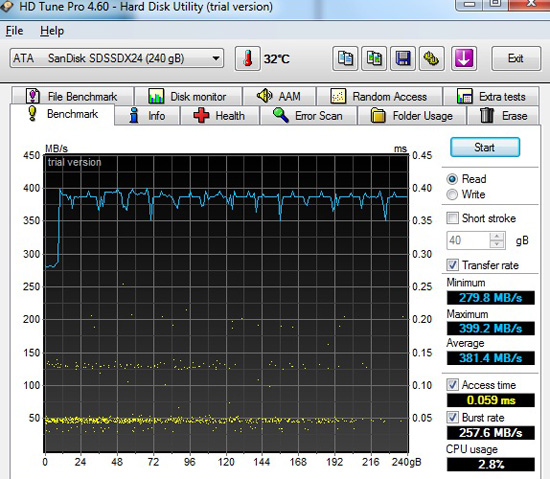
The SanDisk Extreme 240GB SSD achieves an excellent
Read transfer rate of 381 MB/s and thanks to the nature of its NAND flash memory
it can achieve incredibly low access times of 0.059ms. In the results chart below we get a better
sense of how the SanDisk SSD directly compares to OCZ's Vertex 3 (the SD
is slightly quicker) and a half dozen hard drives.
 HD Tune 4.01 - Read
Tests HD Tune 4.01 - Read
Tests |
| Read Average Transfer Rate: (MB/s) |
Points |
Ranking |
| Western Digital RE4 1TB WD1003FBYX HDD |
111.8 |
   |
| Western Digital 1TB WD1001FALS HDD |
86.1 |
|
 SanDisk Etreme 240GB
SSD SanDisk Etreme 240GB
SSD |
381.4 |
   |
| OCZ Vertex 3 240GB SSD |
375.1 |
|
| OCZ Vertex 2 128GB SSD |
233.1 |
|
| Plextor PX-128M1S SSD |
100.1 |
|
| Seagate 3TB Barracuda XT HDD |
117.5 |
|
| Seagate 2TB Barracuda XT HDD |
110.2 |
|
| Seagate 750GB Momentus XT SSHD |
90.7 |
|
| Seagate 500GB Momentus XT SSHD |
84 |
|
| Read Access Time: (ms) |
Points |
Ranking |
| Western Digital RE4 1TB WD1003FBYX HDD |
12 |
|
| Western Digital 1TB WD1001FALS HDD |
12.2 |
|
| SanDisk Etreme 240GB
SSD |
0.054 |
|
| OCZ Vertex 3 240GB SSD |
0.132 |
|
| OCZ Vertex 2 128GB SSD |
0.056 |
|
| Plextor PX-128M1S SSD |
0.3 |
|
| Seagate 3TB Barracuda XT HDD |
26.8 |
|
| Seagate 2TB Barracuda XT HDD |
16.6 |
|
| Seagate 750GB Momentus XT SSHD |
0.615 |
|
| Seagate 500GB Momentus XT SSHD |
16.9 |
|
| Read Burst Rate: (MB/s) |
Points |
Ranking |
| Western Digital RE4 1TB WD1003FBYX HDD |
176.5 |
|
| Western Digital 1TB WD1001FALS HDD |
134.4 |
|
| SanDisk Etreme 240GB
SSD |
257.6 |
|
| OCZ Vertex 3 240GB SSD |
347 |
|
| OCZ Vertex 2 128GB SSD |
216.8 |
|
| Plextor PX-128M1S SSD |
101 |
|
| Seagate 3TB Barracuda XT HDD |
367.6 |
|
| Seagate 2TB Barracuda XT HDD |
312.4 |
|
| Seagate 750GB Momentus XT SSHD |
155.9 |
|
| Seagate 500GB Momentus XT SSHD |
183.5 |
| |
| HD Tune Pro 4.01 Benchmark - WRITE
Tests |
Source: HD
TUNE |
|
HD Tune
Pro is an extended version of HD Tune which includes many new features such as:
write benchmark, secure erasing, AAM setting, folder usage view, disk monitor,
command line parameters and file benchmark. The benchmark measures raw
performance in a couple different ways to measure a hard drive for Read and
Write tests, which are conducted separately. To read the results below consider
that highest minimum/maximum/average transfer rates are better, while lower
(quicker) access times are best. Lastly, highest burst rates are better.
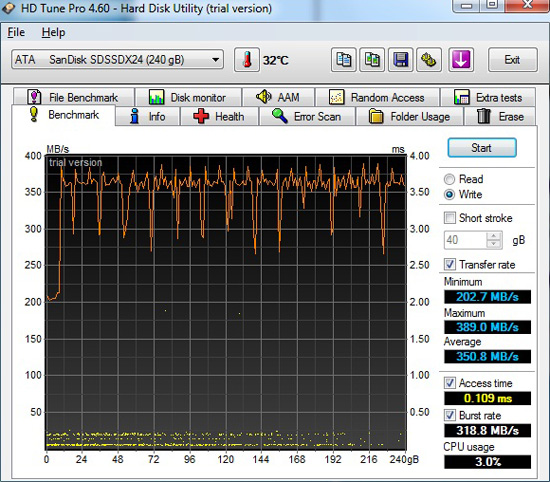
In the HD
Tune write test, the SanDisk Extreme 240GB SSD has a
very low access time of 0.109ms and average write transfer rate of 350.8MB/s,
excellent compared to the OCZ Vertex 3 SSD at 312MB/s. The SanDisk Extreme SSD
blows the other SSDs out of the water, and indeed every HDD
as you'd expect.
| HD Tune 4.01 - Write
Tests |
| Write Average Transfer Rate: (MB/s) |
Points |
Ranking |
| Western Digital RE4 1TB WD1003FBYX HDD |
108.9 |
|
| Western Digital 1TB WD1001FALS HDD |
85.4 |
|
| SanDisk Etreme 240GB
SSD |
350.8 |
|
| OCZ Vertex 3 240GB SSD |
312.9 |
|
| OCZ Vertex 2 128GB SSD |
215.4 |
|
| Plextor PX-128M1S SSD |
73.4 |
|
| Seagate 3TB Barracuda XT HDD |
112.5 |
|
| Seagate 2TB Barracuda XT HDD |
105.1 |
|
| Seagate 750GB Momentus XT SSHD |
86.5 |
|
| Seagate 500GB Momentus XT SSHD |
80.9 |
|
| Write Access Time: (ms) |
Points |
Ranking |
| Western Digital RE4 1TB WD1003FBYX HDD |
4.4 |
|
| SanDisk Etreme 240GB
SSD |
0.109 |
|
| OCZ Vertex 3 240GB SSD |
0.146 |
|
| Seagate 3TB Barracuda XT HDD |
17.9 |
|
| Seagate 2TB Barracuda XT HDD |
8.03 |
|
| Seagate 750GB Momentus XT SSHD |
15.8 |
|
| Seagate 500GB Momentus XT SSHD |
9.05 |
|
| Write Burst Rate: (MB/s) |
Points |
Ranking |
| Western Digital RE4 1TB WD1003FBYX HDD |
157.1 |
|
| SanDisk Etreme 240GB
SSD |
318.8 |
|
| OCZ Vertex 3 240GB SSD |
335 |
|
| Seagate 3TB Barracuda XT HDD |
339.3 |
|
| Seagate 2TB Barracuda XT HDD |
189 |
|
| Seagate 750GB Momentus XT SSHD |
250 |
|
| Seagate 500GB Momentus XT SSHD |
177.4 |
| |
|